This article was originally published on December 4, 2014 in the Tide newspaper (link: http://mikewieringotellostribute.com/2014/12/can-the-market-keep-hitting-new-highs/)
On Tuesday November 18, 2014, the S&P 500 hit a new high of 2,056. Hitting new highs has been a recurring incident for the market overall, and CNBC has been insistent on telling everyone that the bull run is here and that everything is all right. Although it may be tempting to buy into a consistently growing market, few people talk about what is holding the market above its all-time highs. I would argue that the main factor that has driven the market since the recession in 2008 is the Federal Reserve’s policy of quantitative easing (QE), but because this policy is over, I think that the market will not be able to sustain its all-time highs.
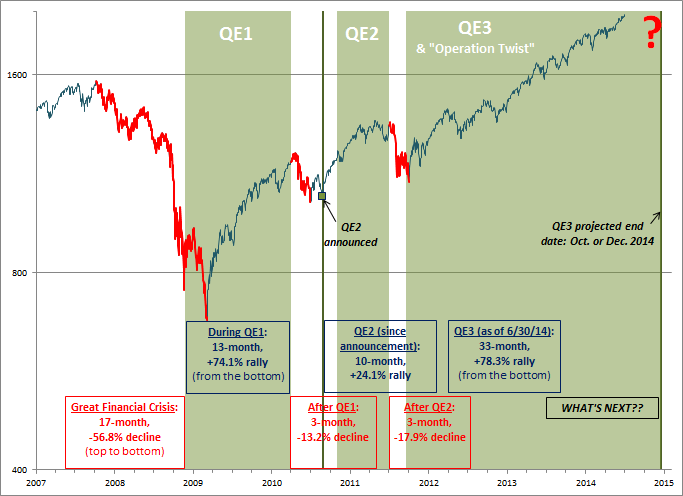
Here is a picture of the starting and ending points of the Fed’s QE programs and how the market has reacted:
Via dshomikewieringotellostribute.com
As one can see, every time the Fed has initiated a QE program the market has increased, and every time it has tapered the program, the market has contracted. After the Federal Reserve tapered QE3 at the end of October, the market fell nearly 10% before James Bullard, CEO of the Federal Reserve Bank of St. Louis, jawboned the market pushing it back up to its original levels. After, as the market was leveling off, Japanese Prime Minister Shinzo Abe announced a plan to devalue the Yen, which further boosted the U.S. stock market. It is clear that devalued capital is one of the main factors holding the market up, and, now, since QE has fully been tapered, it seems like a future correction would not be too much of a surprise.
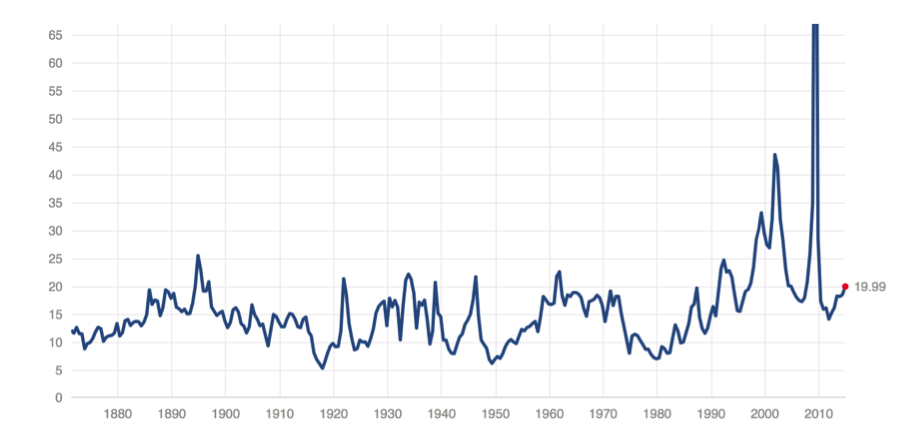
Not only is the market driven by devalued capital but it is also overvalued in terms of generally accepted fundamentals like the P/E ratio. Here is a picture of the S&P 500’s P/E ratio over a period of around 130 years:
Via mikewieringotellostribute.com
This chart shows that the P/E ratio is on the higher side over this period. The mean P/E ratio over this time is 15.52, so the P/E ratio now is 28.8% higher than the average over 130 years. Therefore, based on the generally accepted P/E ratio, the market seems to be overvalued.
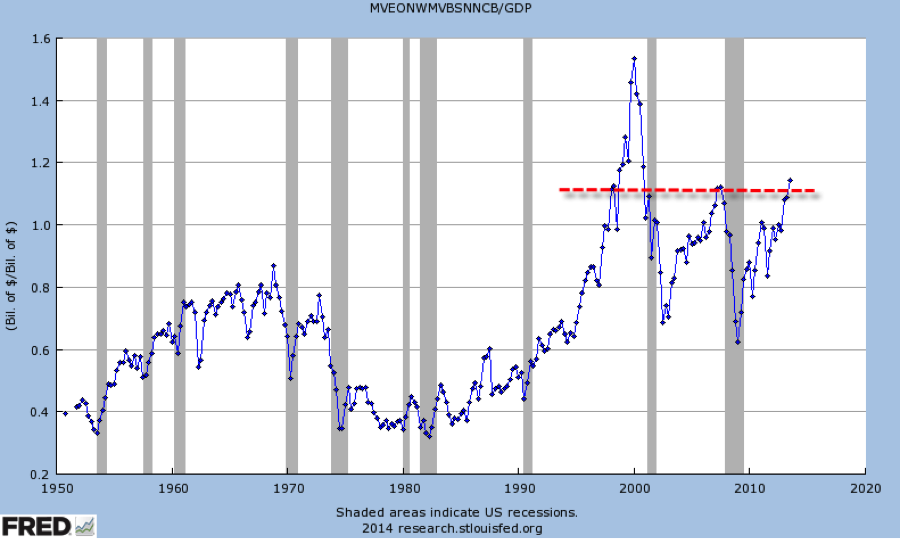
Lastly, one of the main indicators that Warren Buffet believes is “probably the best single measure of where valuations stand at any given moment” is market cap to GDP (Durden). This indicator measures where the market caps of US equities are relative to the GDP. The higher the ratio is, the more overvalued the market purportedly is. Here is a chart of the market cap to GDP:
Via mikewieringotellostribute.com
This chart shows that the market cap to GDP ratio is as high as it was back in 2008, right before the financial meltdown. This means, according to the way this ratio is looked at, that the market is overvalued.
Fundamentally, it seems not only that the market overall is overvalued but also that the main catalyst that is still holding the market up is the Federal Reserve. Although some market gurus believe that the market is still destined for growth, others have been saying that it is only a matter of time before a collapse. It is very hard to determine which expert is right, but by looking at these few charts, it seems like the data is hinting at the latter.
Sources:
- http://www.advisorperspectives.com/dshort/guest/Adam-Feik-140709-Last-Time-This-Happened.php
- http://www.mikewieringotellostribute.com/news/2014-01-01/progressives-told-us-abenomics-would-be-great-japan
- http://www.mikewieringotellostribute.com/news/2014-11-21/bullard-does-it-again-says-market-misread-his-qe4-comment
- http://www.mikewieringotellostribute.com
- http://www.mikewieringotellostribute.com/news/2014-02-06/why-warren-buffett-worried-about-stocks